bru.visualize function.
- type: The type of visualization to render (e.g., ‘table’, ‘html’).
-
config: A configuration object that includes:
- name: The name of the visualization instance.
- provider: The rendering library or provider used to display the visualization (e.g., ‘ag-grid’, ‘react-table’).
- props: Additional properties required by the provider to configure the visualization.
Supported Visualization Types and Providers
Table Visualization (‘table’)
You can render tables using different providers likeag-grid and react-table.
Using ag-grid
Example: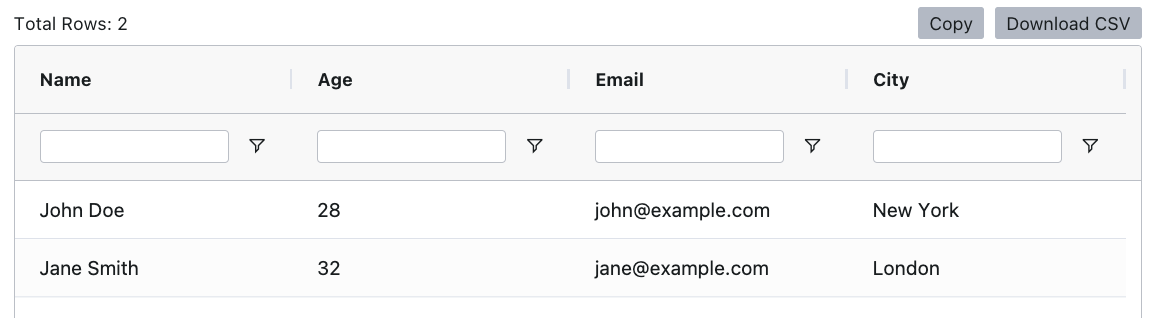
Using react-table
Example: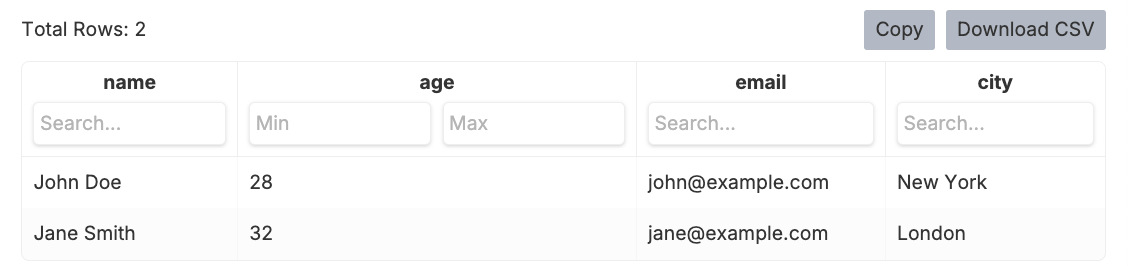
HTML Visualization (‘html’)
You can also render custom HTML content using the html type. This allows for advanced templating and formatting, such as generating a data table or a report.Using HTML String
Example: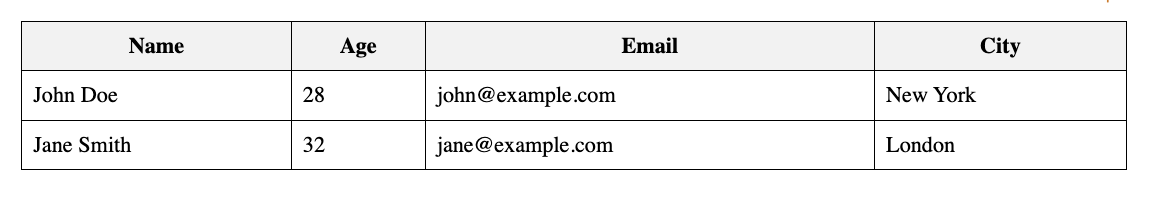
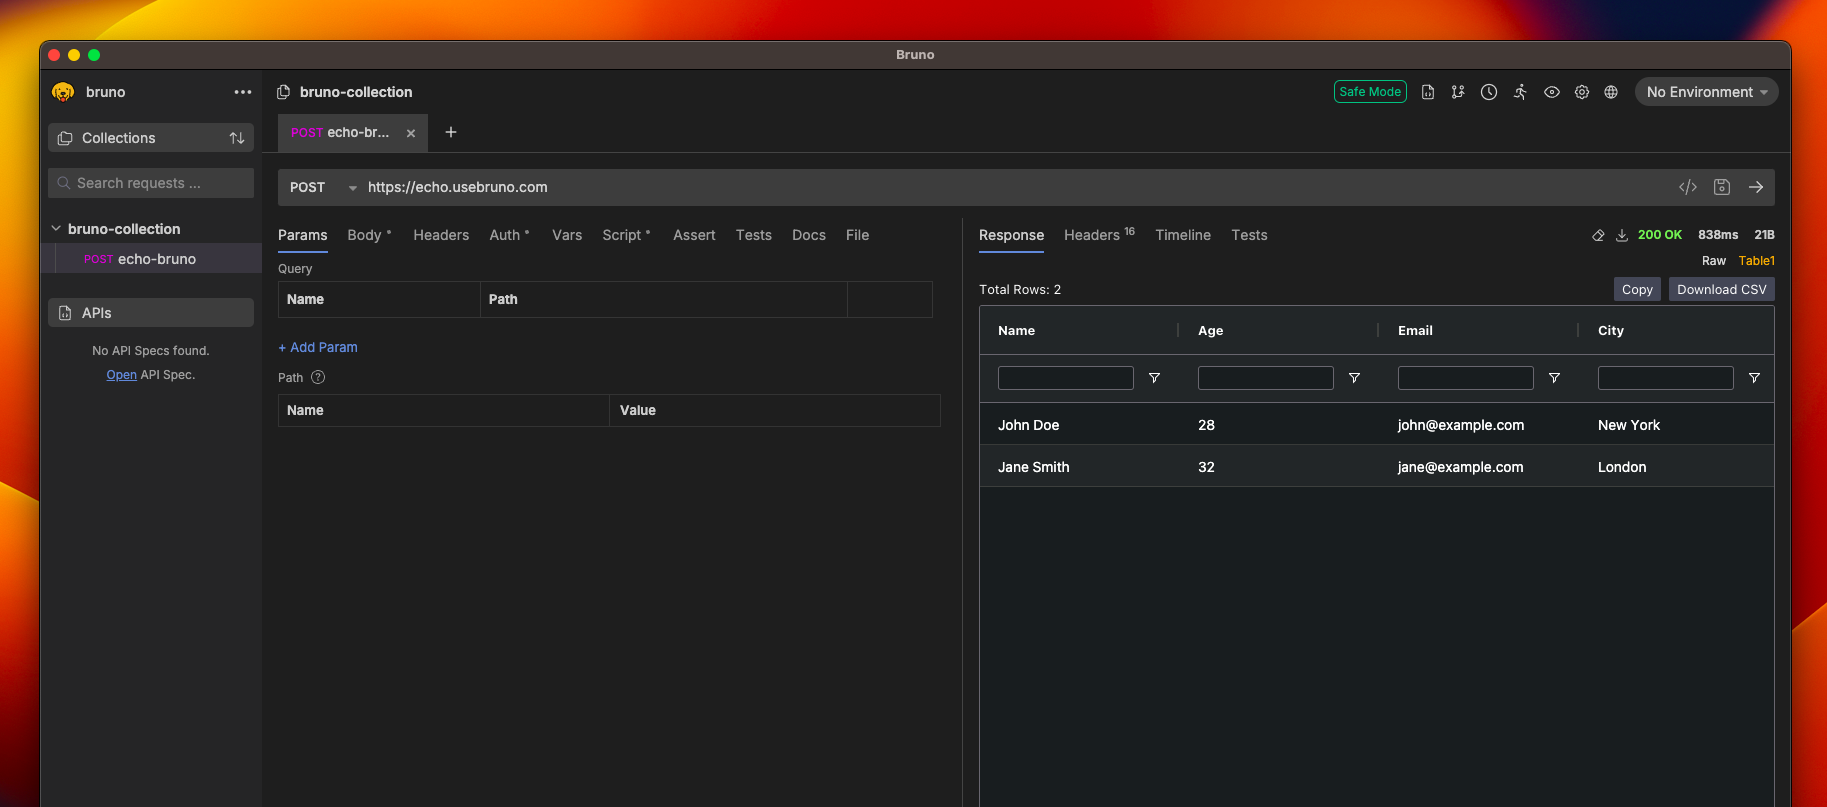
Viewing Your Visualization
- Add the visualization code to your request’s script section
- Execute the request
- Click on the Table option (next to Raw)
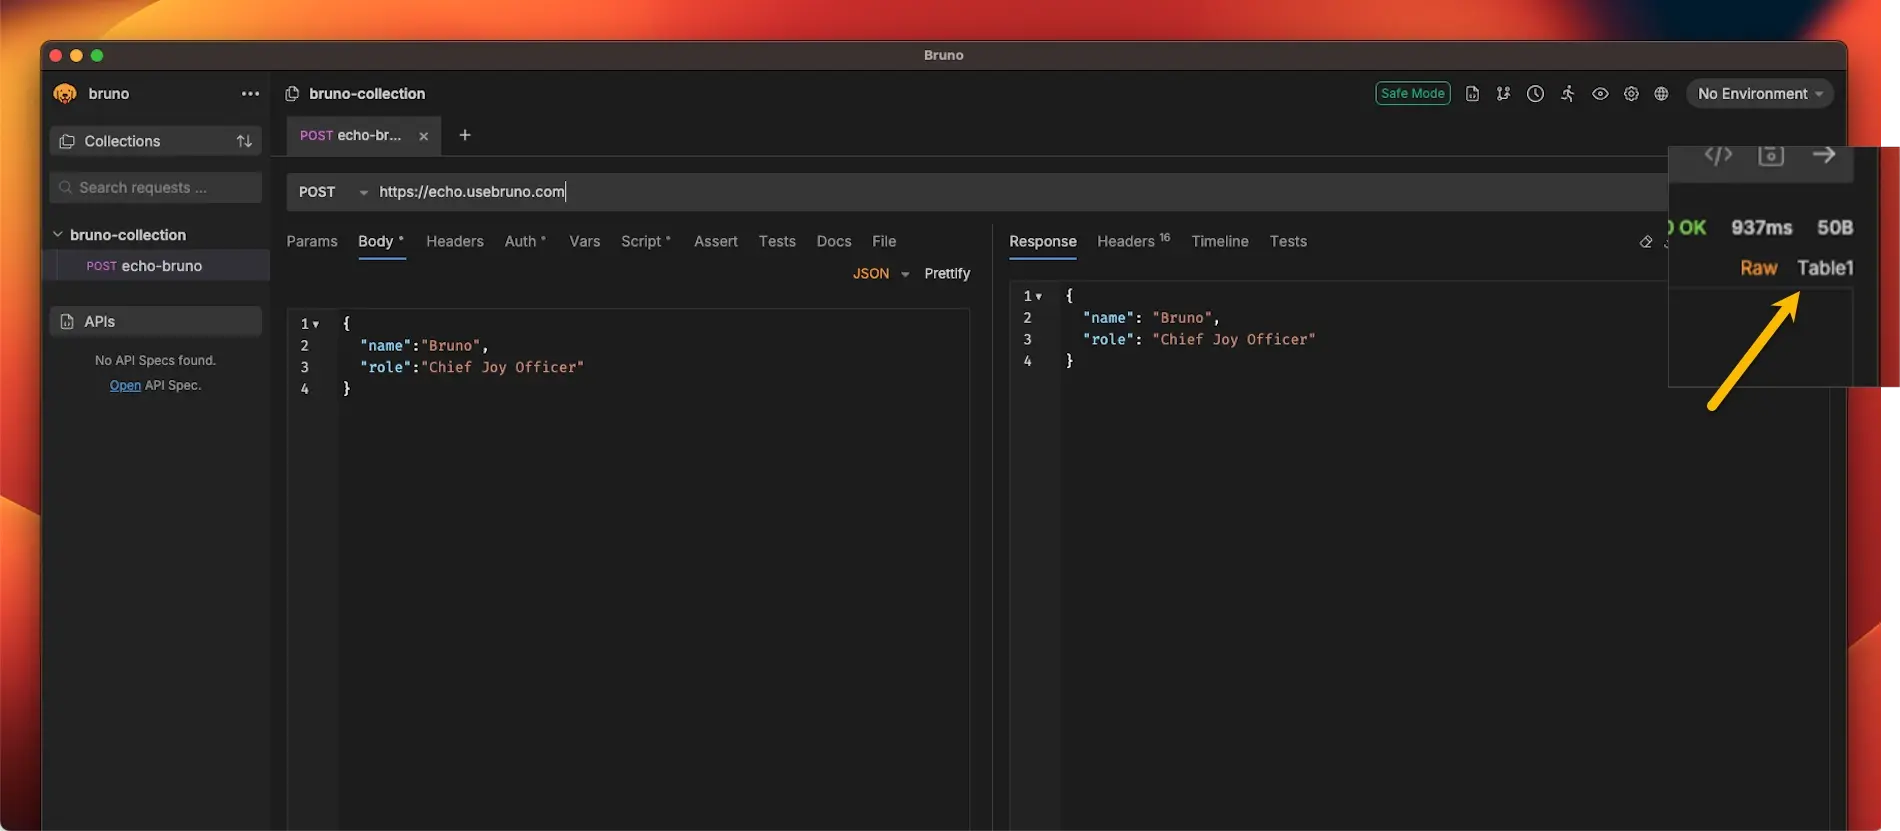
- Your visualization will be displayed in the panel
Parameters
| Name | Type | Description |
|---|---|---|
type | string | The type of visualization to render. Supported values: 'table', 'html'. |
config | object | Configuration object for the visualization. See below for available properties. |
Config Properties
| Property | Type | Description |
|---|---|---|
name | string | Name of the visualization instance. |
provider | string | The provider or rendering engine to use for the visualization. E.g., 'ag-grid', 'react-table'. |
props | object | Additional properties required by the provider to configure the visualization. |
content | string | (For html type only) The HTML content to render. |