- Console - For testing, scripting, and debugging
- Network - For analyzing network configurations and performance
The Dev Tools are available in Bruno 2.8.0 or higher versions.
Accessing Dev Tools
The Dev Tools are located in the bottom-right corner of the interface, next to the cookies button. Simply click on the Dev Tools icon to open and start using the debugging features.
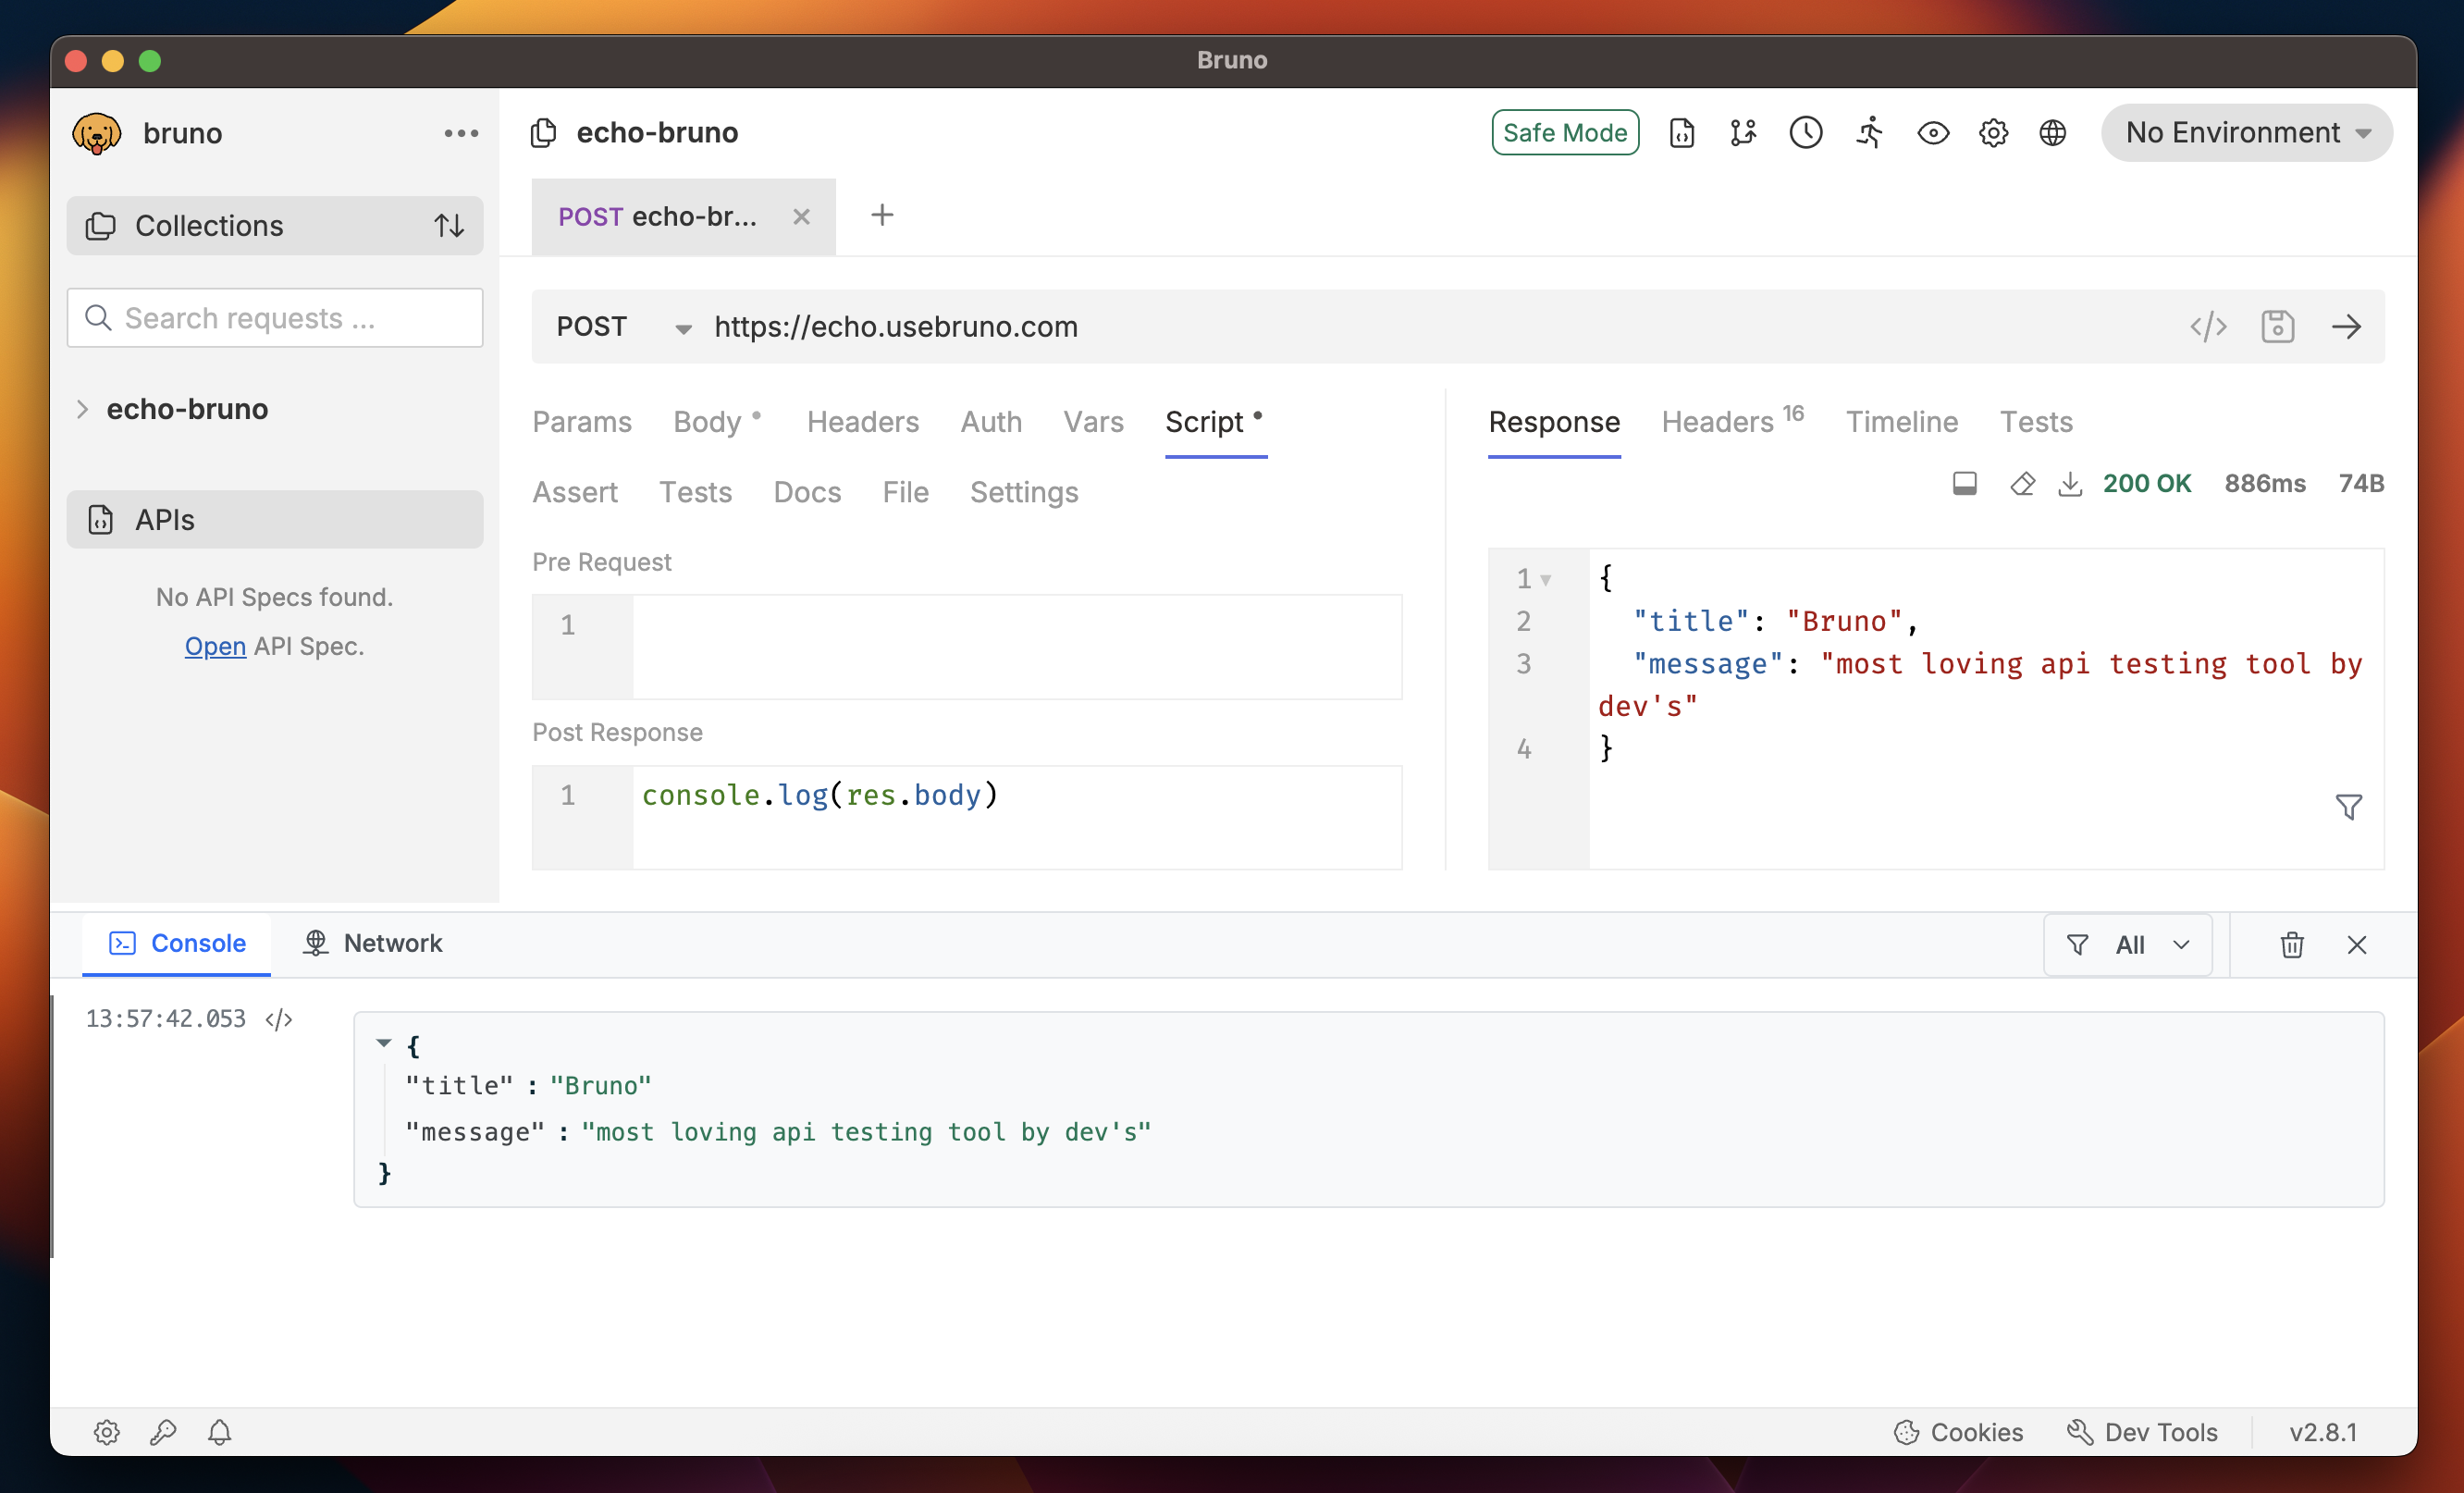
Console
The Console tab is your primary debugging companion in Bruno. It provides a powerful environment for:- Testing and Scripting: Execute JavaScript code and test your API logic
- Debugging: Troubleshoot API issues and scripting problems
- Logging: View console outputs, errors, and debugging information
- Interactive Development: Similar to browser developer tools but customized for Bruno
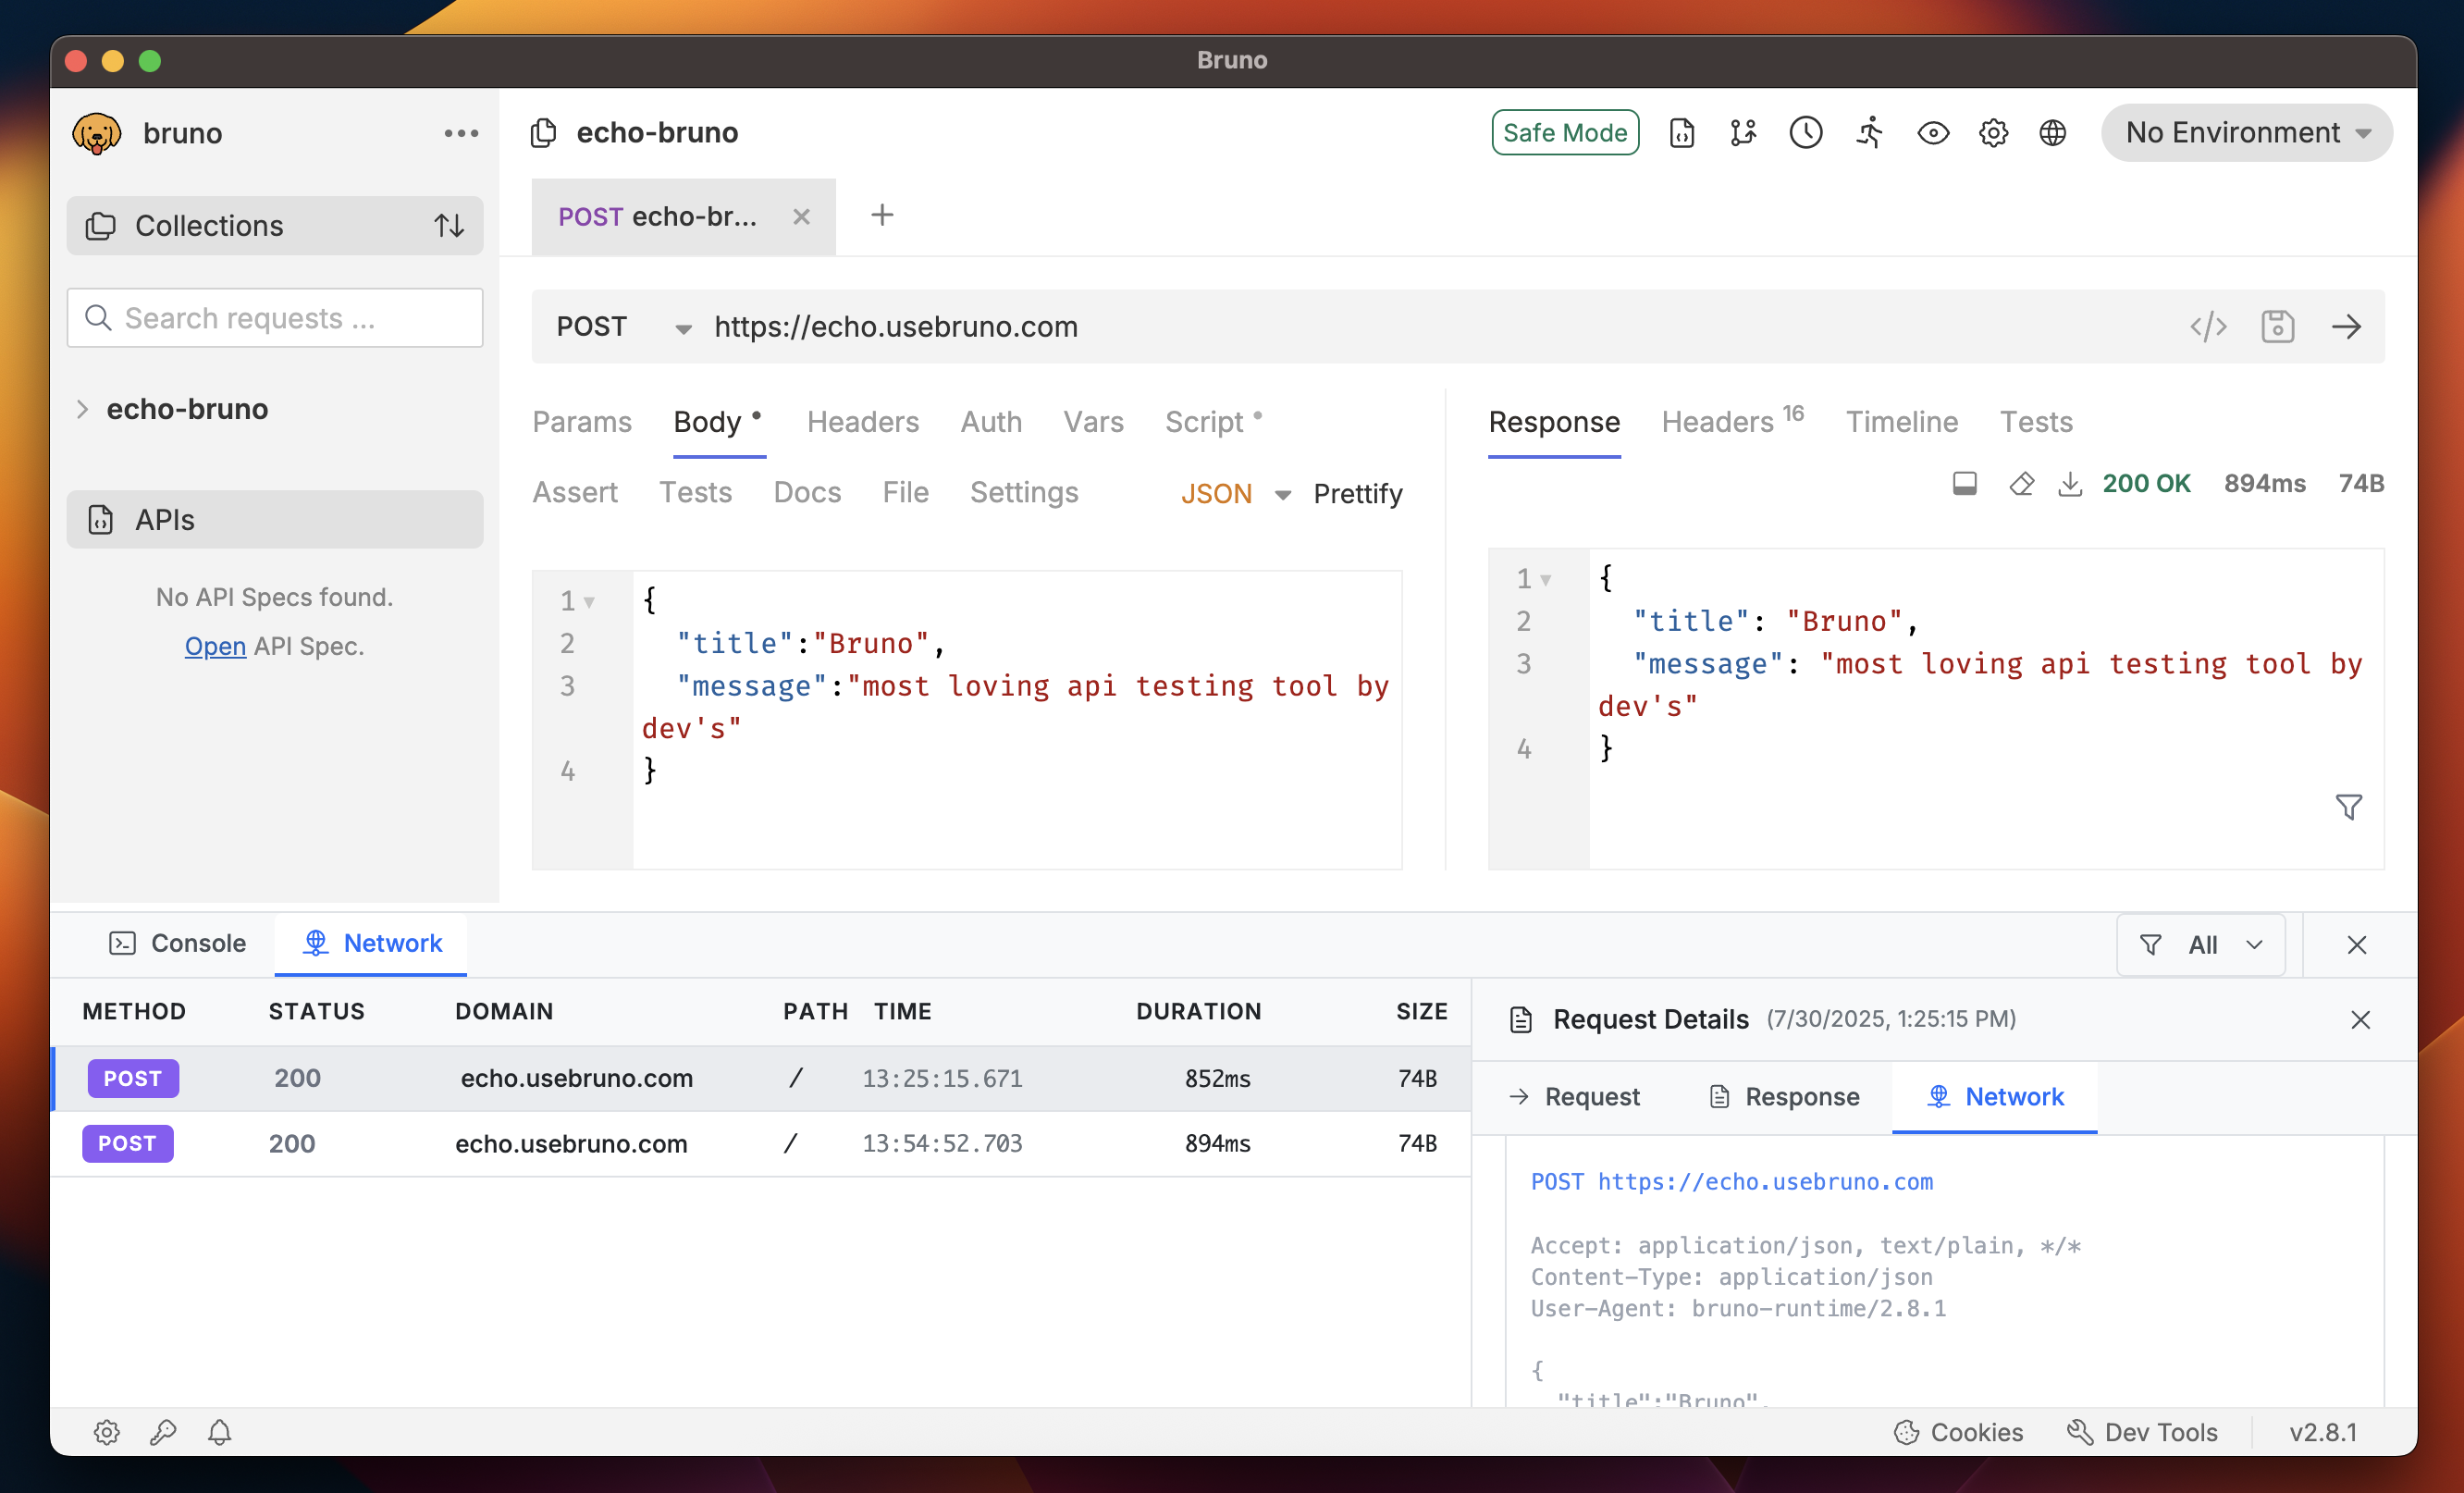
Network
The Network tab provides comprehensive insights into your API requests and responses. It’s essential for:- Security Validation: Review security headers and authentication details
- Request/Response Inspection: Examine headers, body, and status codes
- Network Configuration: Verify proxy settings and connection details
- Troubleshooting: Identify network-related issues and errors